Transparency Portal

Explore our program data and metrics through interactive dashboards

By the end of July 2026, 1,554 beneficiaries had completed programmes across the three grant lots. Of those who completed a programme, 1,142 were women (73.5%) and 412 were men (26.5%).

Beneficiaries by Target Group
  • NEET 545 (35%)
  • Cash Assistance (NE) 682 (44%)
  • People with Disabilities (PWDs) 313 (20%)
  • Y.M up to 18 y.o (Y.M) 14 (1%)
Beneficiaries by Lot
  • LOT1 824 (53.0%)
  • LOT2 467 (30.1%)
  • LOT3 263 (16.9%)
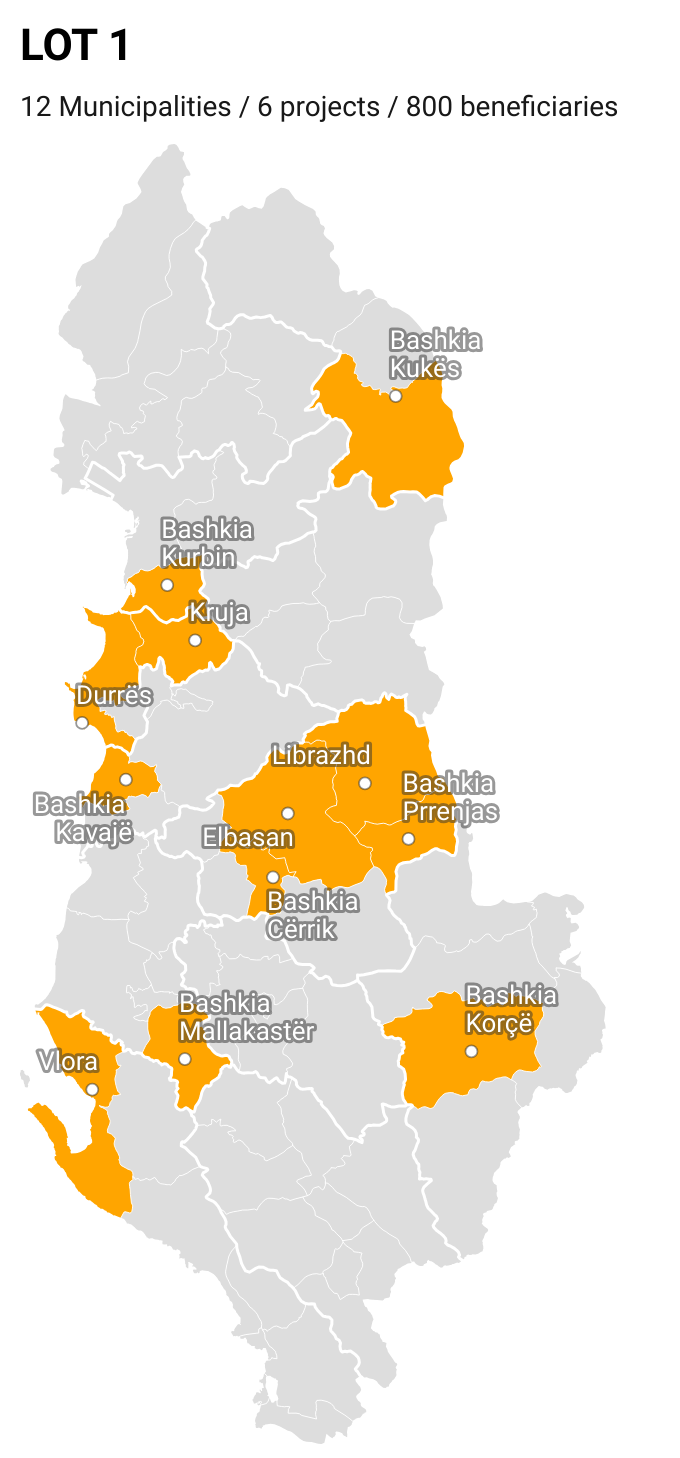
Beneficiaries by Municipality
  • LOT1
  • LOT2
  • LOT3
Beneficiaries

Labour Market Activation & Employment Outcomes

After completion, 644 beneficiaries (41.4%) found work, became self-employed, enrolled in vocational courses, began internships or joined other active labour market programmes offered by the National Agency for Employment and Skills (NAES).

All three lots combined

Across all three lots, 1,554 beneficiaries completed a programme. Each percentage below is a share of that total.

644 beneficiaries became active in the labour market.

Employed or self-employed
351 (22.6%)
Enrolled in further professional skills programmes
293 (18.9%)

Percentages are based on everyone who completed the programme in each lot.

LOT1

824 beneficiaries completed intensive counselling. Follow-up included mentoring, job referrals and support to access public and private employment services, public and non-public vocational training, and social services.

346 beneficiaries became active in the labour market.

Employed or self-employed
25.8%
Enrolled in further professional skills programmes
16.1%

LOT2

467 beneficiaries completed the SCUL programme. Follow-up included mentoring, job referrals, assessment of employment potential, and access to employment services, vocational training and social services.

155 beneficiaries became active in the labour market.

Employed or self-employed
18.8%
Enrolled in further professional skills programmes
14.3%

LOT3

263 beneficiaries completed specialised training and support programmes for people with disabilities. Follow-up included mentoring, job referrals, assessment of employment potential, and access to employment services, vocational training and social services.

143 beneficiaries became active in the labour market.

Employed or self-employed
19%
Enrolled in further professional skills programmes
35.4%

For LOT1 and LOT2, the two reported outcome percentages add up to 0.1 percentage point less than the activation rate.


Grant budgets and beneficiaries

Project budget by lot
  • Lot 1 66,337,196.80 lek (55.23%)
  • Lot 2 31,329,683.76 lek (26.08%)
  • Lot 3 22,442,365.40 lek (18.68%)
Beneficiaries By Grantee
  • LOT1
  • LOT2
  • LOT3
Beneficiaries
Budget by Grantee
  • LOT1
  • LOT2
  • LOT3
Budget (million lek)

Note

This dashboard provides public access to our program data, showing the distribution of grants across the 19 target municipalities and the impact on our four target groups: NEETs, young mothers, people with disabilities, and beneficiaries of cash assistance. For more detailed reports or specific data requests, please contact our team.


Regional Coverage Maps

Coverage Map